


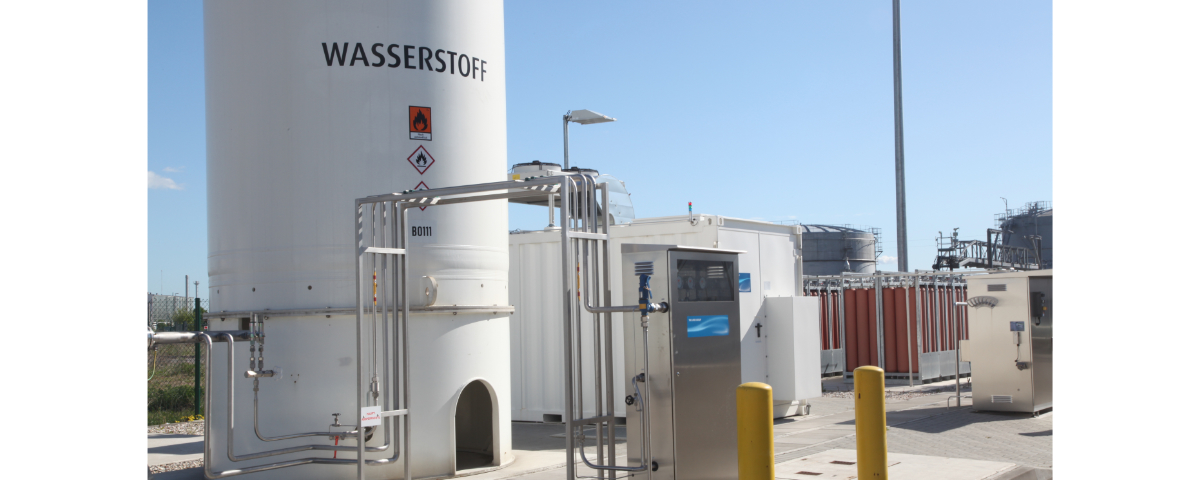
Hydrogen production in Germany: New study shows advantages of decentralized electrolysers
10. March 2022
Understanding energy transition – Dashboard developed and published for WWF Germany
18. March 2022Energy transition dashboard for WWF Germany
RLI developed an energy transition dashboard for WWF Germany. The digital tool shows important data and facts about the energy transition and climate change. In ten interactive fields, users can learn about complex interrelationships such as CO2 emissions worldwide and in Germany or energy supply.
Understanding energy transition
Energy transition is an integral part of the fight against climate change and thus for the protection of nature and people. The term is much more than just switching from fossil fuels to renewable energies. Electrification, energy systems, climate data, CO2 emissions, mobility – these are just a selection of topics on which a multitude of data and facts are available. The contexts are often difficult to understand. The dashboard is designed to help by providing a vivid, interactive and playful access to relevant energy and climate facts. The dashboard helps people who are looking for comprehensible information on energy transition and climate protection and which are interested in WWF topics. It also supports decision-makers in politics and business as well as journalists in their work by providing facts and figures.
Everything at a glance
From the daily updated electricity mix to CO2 trends for a climate-neutral Germany, the dashboard shows information. For example, users can find the status of national and global CO2 emissions, the share of renewable energies in the electricity mix, and the use of electricity-based climate technologies in Germany. With the help of a slider, users are able to get an overview of the current situation as well as changes over the past few years.
Share information easily
The individual topics can be easily shared or embedded. The dashboard content is social media enabled and can be used on the usual channels like Twitter or Facebook.
Technical basis and data
The RLI developed the new dashboard based on a previous version of the WWF from 2017. The tool is implemented as a flask application in python. This supports the creation of interactive dashboards, using the graphics library D3 for visualizations. The instrument is developed according to the mobile first approach in responsive design. It is optimzed for use on mobile devices. l°energy was responsible for content and data research.
Project period: October 2021- February 2022
Go to WWF Energiewende Dashboard
The RLI assumes the following tasks:
- Customization of the themes in the dashboard
- Determine themes and content of the tiles
- Determine interactive elements
- Design development
- Create mockups in corporate design
- Develop responsive design (mobile-first)
- Implementation of the dashboard
- Set up server structure (docker)
- Implement dashboard (flask)
- Customize design and layout (bootstrap, CSS)
- Integrate data source (JSON)
- Create visualization (D3)