Mobility with Renewable Energy


In the Research Unit Mobility with Renewable Energy at RLI, we conduct research at the interface of sustainable drive systems and renewable power generation. The transport sector contributes a large share to global greenhouse gas emissions through gasoline and diesel vehicles. Fine dust and nitrogen oxides also pollute the air in cities. The potential to reduce emissions with alternative drive systems is enormous, provided that the basic supply comes from renewable energy sources.

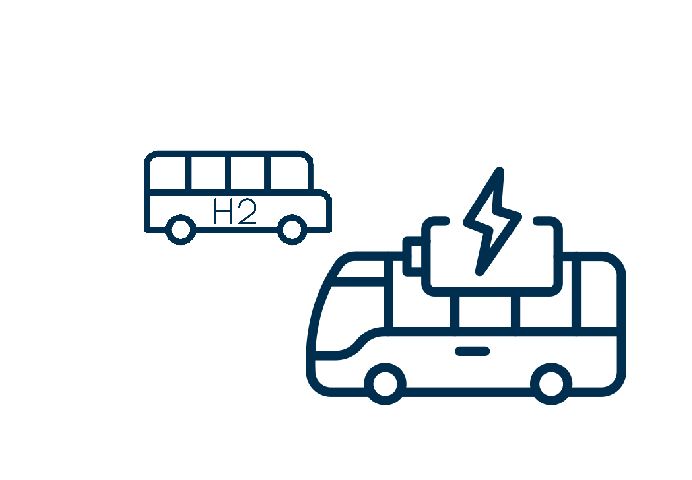
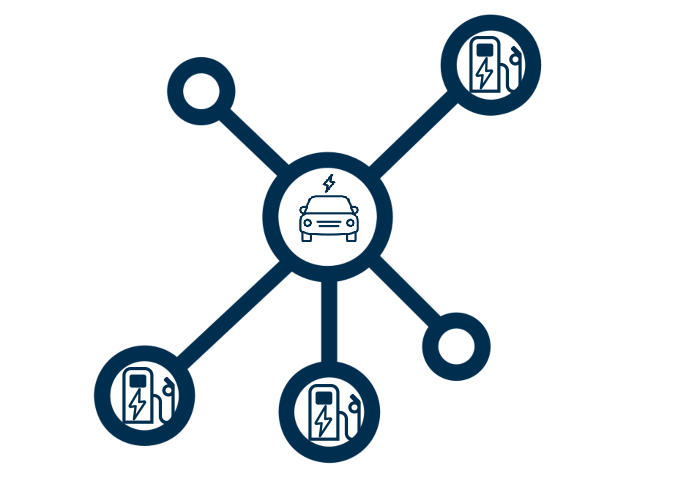
Our Unit develops sustainable mobility concepts for cities and municipalities as well as for private and municipal companies – for example, for public transport, municipal utilities, waste management, or housing companies. We support these players in implementing the concepts by developing catalogs of measures and implementation strategies with the help of strategy workshops, potential analyses, and other tools. We see the technical solution for tomorrow's transport in both battery and hydrogen-electric drives – from an energy system perspective, a combination of both would be ideal. We are planning charging infrastructure and developing concepts for fleets of hydrogen and battery vehicles.

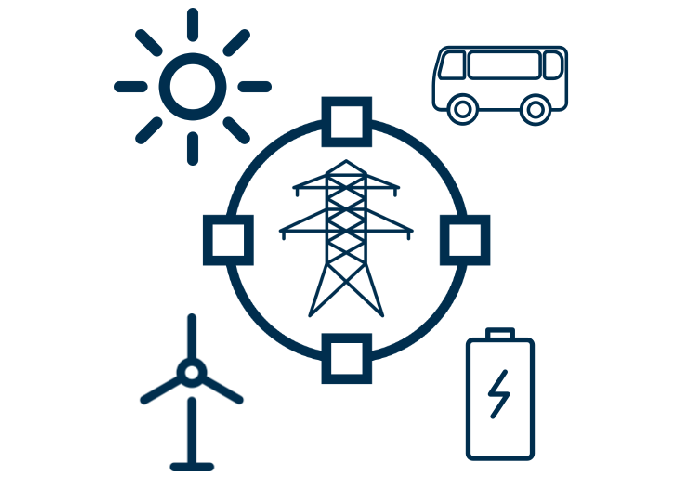
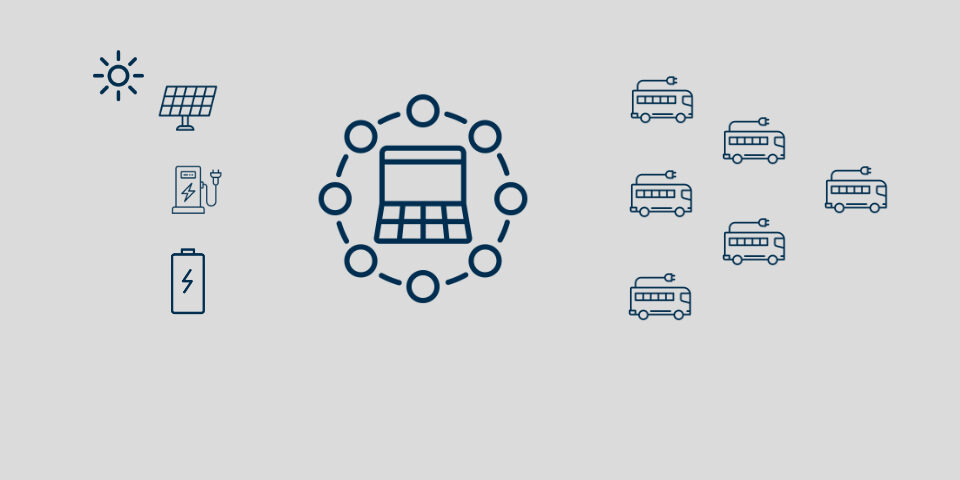
The Unit also analyzes and optimizes mobility-related energy systems using simulation methods. These can be, for example, smart grids, fast charging stations, or hydrogen fueling stations with on-site electrolysis from renewable energy. Our simulation tools make it possible to optimally design plants in advance or to increase the efficiency of existing plants. Our partners are often infrastructure operators, federal authorities, cities, and industrial companies.

Our research focuses on


Das Bild zeigt eine schematische Darstellung: ein Bus, auf dem "H2" geschrieben ist und ein anderer Bus, der eine Batterie und einen Blitz als Zeichen für Elektrizität hat.

Buses

  • Circulation data analysis
  • Driving simulation
  • Charging and refueling simulation
  • Design of the charging and refueling infrastructure
  • Optimization of the charging strategy
  • Integration of renewable energies and storage systems
More
Das Bild zeigt ein Piktogramm eines Zuges mit einem Blitz obendrauf.

Train

  • Digitalization of timetable and route data
  • Demand analysis
  • Infrastructure optimization
  • Visualization of the results
More
Das Bild zeigt eine schmatische Darstellung eines Netzwerks. In der MItte ist ein Auto mit einem Blitz drauf. Von der Mitte ab gehen Linien mit Kreisen am Ende, in denen eine Zapfsäule mit einem Blitz drin ist.

Charging infrastructure

  • Demand and grid analysis
  • Positioning
  • Development of open-source frameworks
More
Das Bild zeigt eine schematische Darstellung: In der Mitte ist ein Kreis mit einem Strommast. Darum sind links oben eine Sonne und im Uhrzeigersinn ein Bus, eine Batterie und ein Windrad positioniert.

4. Grid integration of E-mobility

  • Analysis of the flexibility potential
  • Determination of usage requirements
  • Development of grid- and system-serving charging strategies
  • Development of open source tools
More
Das Bild zeigt verschiedene Piktogramme: In der Mitte das Wort H2, darum ein Flugzeug (oben links) dann im Uhrzeigersinn ein Zug, ein Schiff und ein Bus.

Hydrogen

  • Potential studies
  • Studies on synthetic fuels
  • Analysis and planning
  • Energy system simulation and design
  • Strategies, roadmaps and participation processes
More